Commentary on Stock Markets
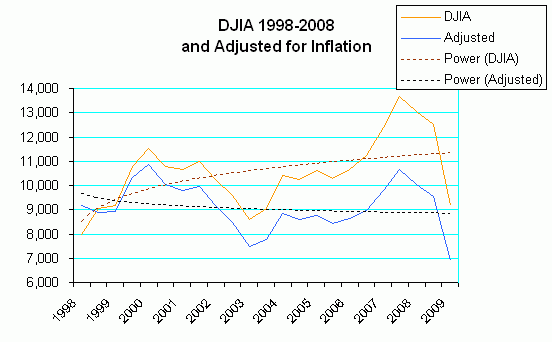
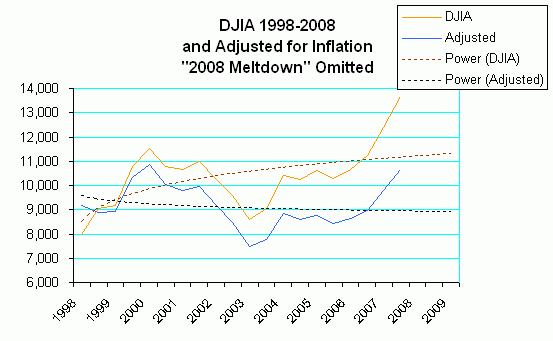
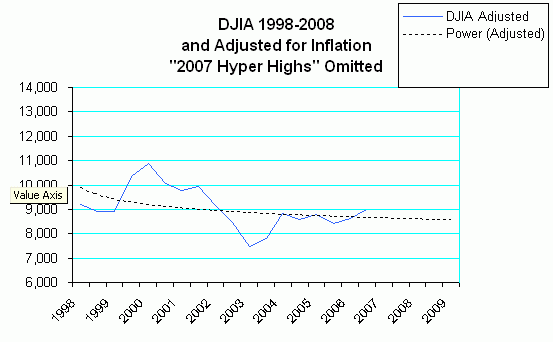
I present three charts of the DJIA. In version c), the years 2007 and 2008 are omitted as aberrant.
The recent decade had the lowest inflation rate of the previous 40 years, so inflation is not 'aberrant' for this study. That low inflation rate is compared to the DJIA stock market index here. DJIA is one of the more conservative investment indexes, much less volatile than small cap stocks, and less volatile than the NASDAQ index. Even with the "Great Meltdown of 2008" or the "Hyper 2007s" omitted, the "DOW" is still a downer. Even with capital gains tax and any other taxes omitted, as they are here, it is a downer.
Note, I am not a finance expert. This is just the DJIA, not an aware person actively trading. But still, this is relevant study, because it is now being claimed that the DJIA performs as well or better than many mutual funds, and the DJIA is being recommended by analysts.
The inflation rates are the lowest in the last forty years.
The hyper 2007s and the hypo 2008s are omitted in versions b) and c).
In all three versions, the DJIA is a loses.
References: www.finance.google.com and www.westegg.com/inflation/inf.cgi
Version a)

Version b)

Version c)

